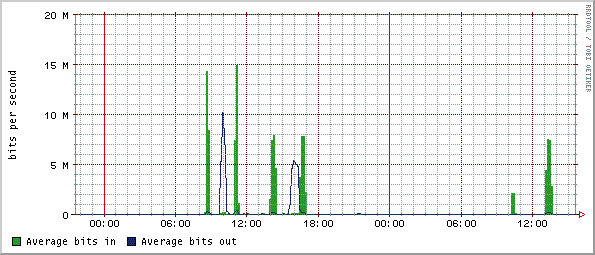
Figure 4: The graph here is for bytes in and out of a server that were used for the multicast software loads. The first three spikes of traffic coincide with the image multicast packets. The other spikes were for software loads to other labs on different ports of the switch.
|
